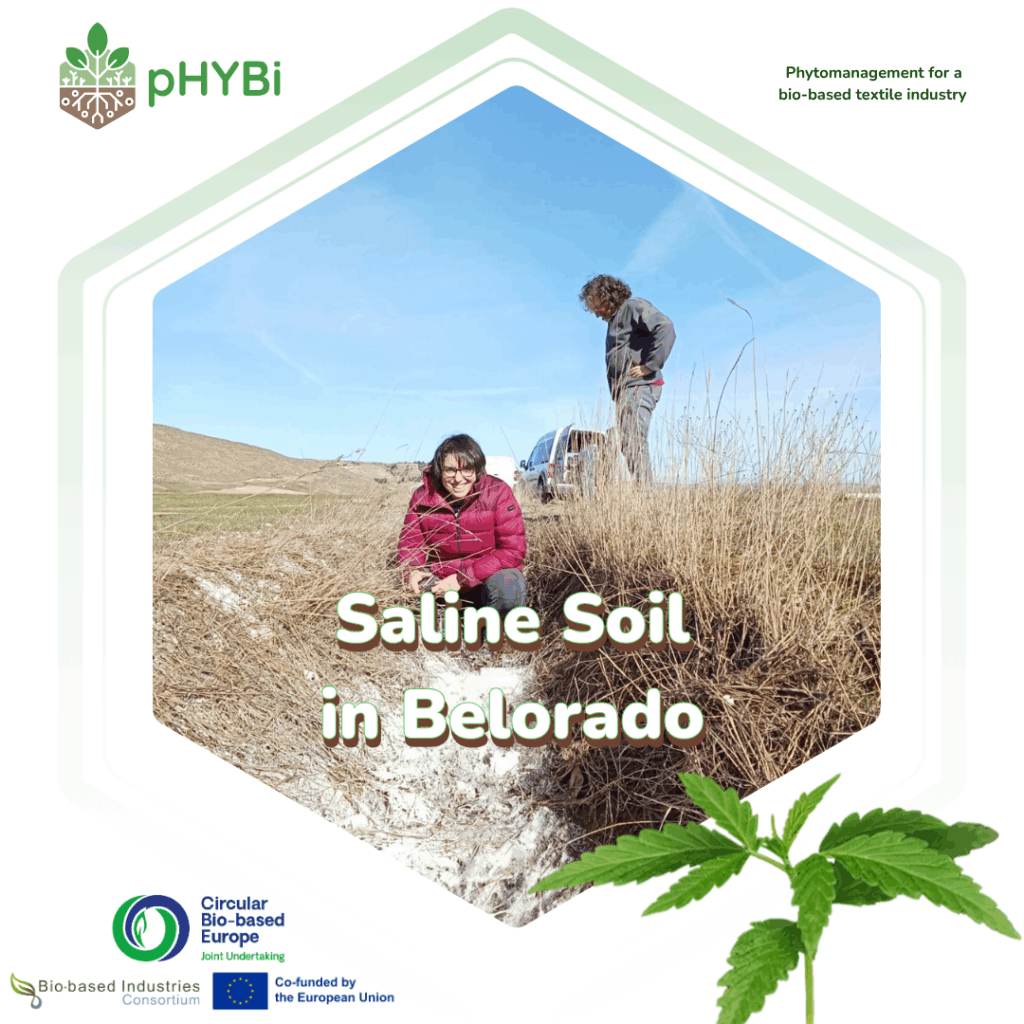
Why Belorado? The Salty Backstory
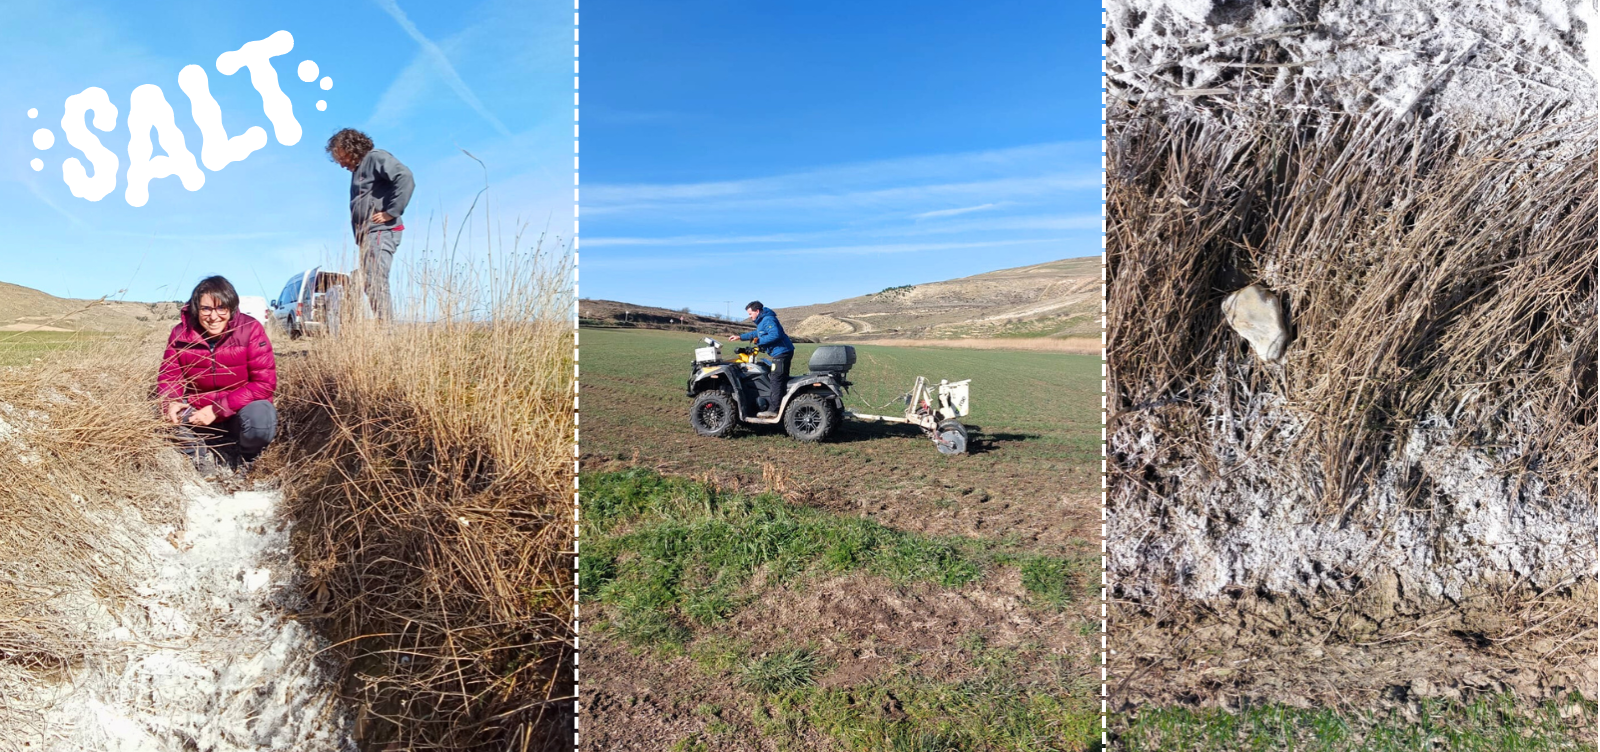
Our journey began with a simple question: Why are some of Belorado’s fields struggling to support healthy crops? The answer, as it turns out, is written in salt. Belorado sits near active mining operations extracting thenardite and glauberite, minerals used to produce anhydrous sodium sulfate. While these minerals are valuable for industry, their extraction can leave behind a less welcome legacy: salt accumulation in the soil.
For local farmers, this means more than just a pinch of salt, it can spell trouble for crop yields, soil structure, and water availability. Reports of salinity-related problems from the farming community made Belorado a perfect candidate for our next case study and remediation trials.
Science in Action: Mapping the (In)visible
On a crisp morning in early February, our team from the Universtiy of Burgos gathered at the site, armed with an arsenal of scientific gadgets. The plan? To map the “(in)visible” problem of soil salinity, using both eyes in the sky and sensors on the ground.
February 5, 2025:
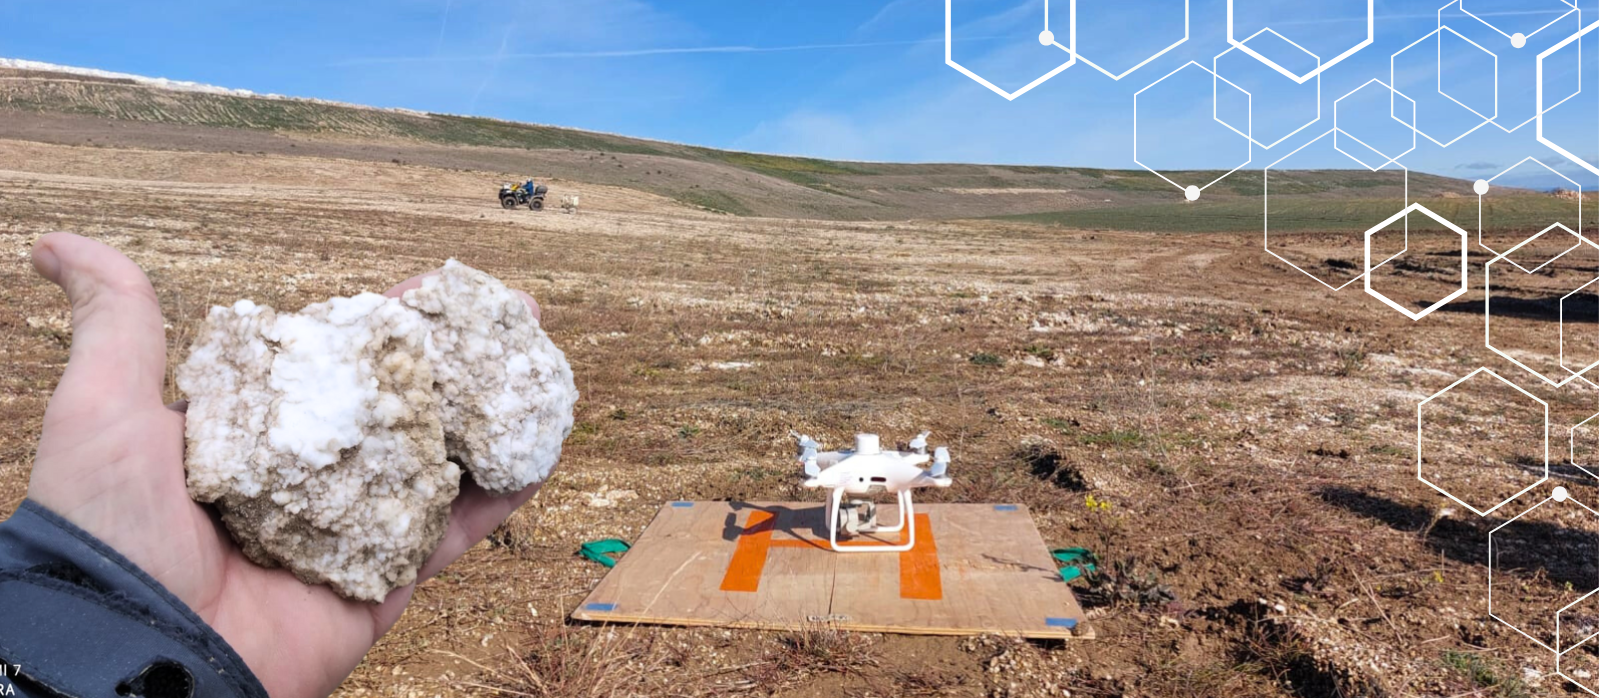
On our first day of fieldwork, drones were used to capture high-resolution images of the landscape. Meanwhile, on the ground, we deployed the Veris system, a vehicle-mounted sensor that measures soil electrical conductivity (EC). Why EC? Because it’s a reliable indicator of soil salinity, moisture, and texture. By combining drone imagery with EC data, we could create detailed maps showing exactly where the salt was lurking.
February 27, 2025:
With the first round of data in hand, we returned for a second sweep, expanding our mapping to additional plots. The resulting conductivity maps were a revelation: blue zones indicated low conductivity, while yellow and red zones showed high levels (and thus, high salinity). These maps provided us with a scientific roadmap for targeted soil sampling and future remediation.
Getting Our Hands Dirty: Soil Sampling, pHYBi-Style
High-tech tools are great, but sometimes you need to dig a little deeper – literally. That’s where our soil sampling methodology came in, following the rigorous LUCAS protocol.
April 2 & 8, 2025:
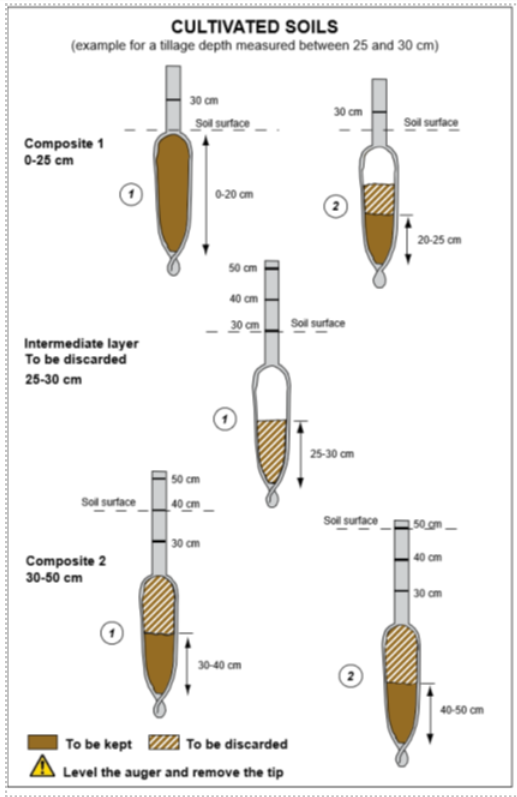
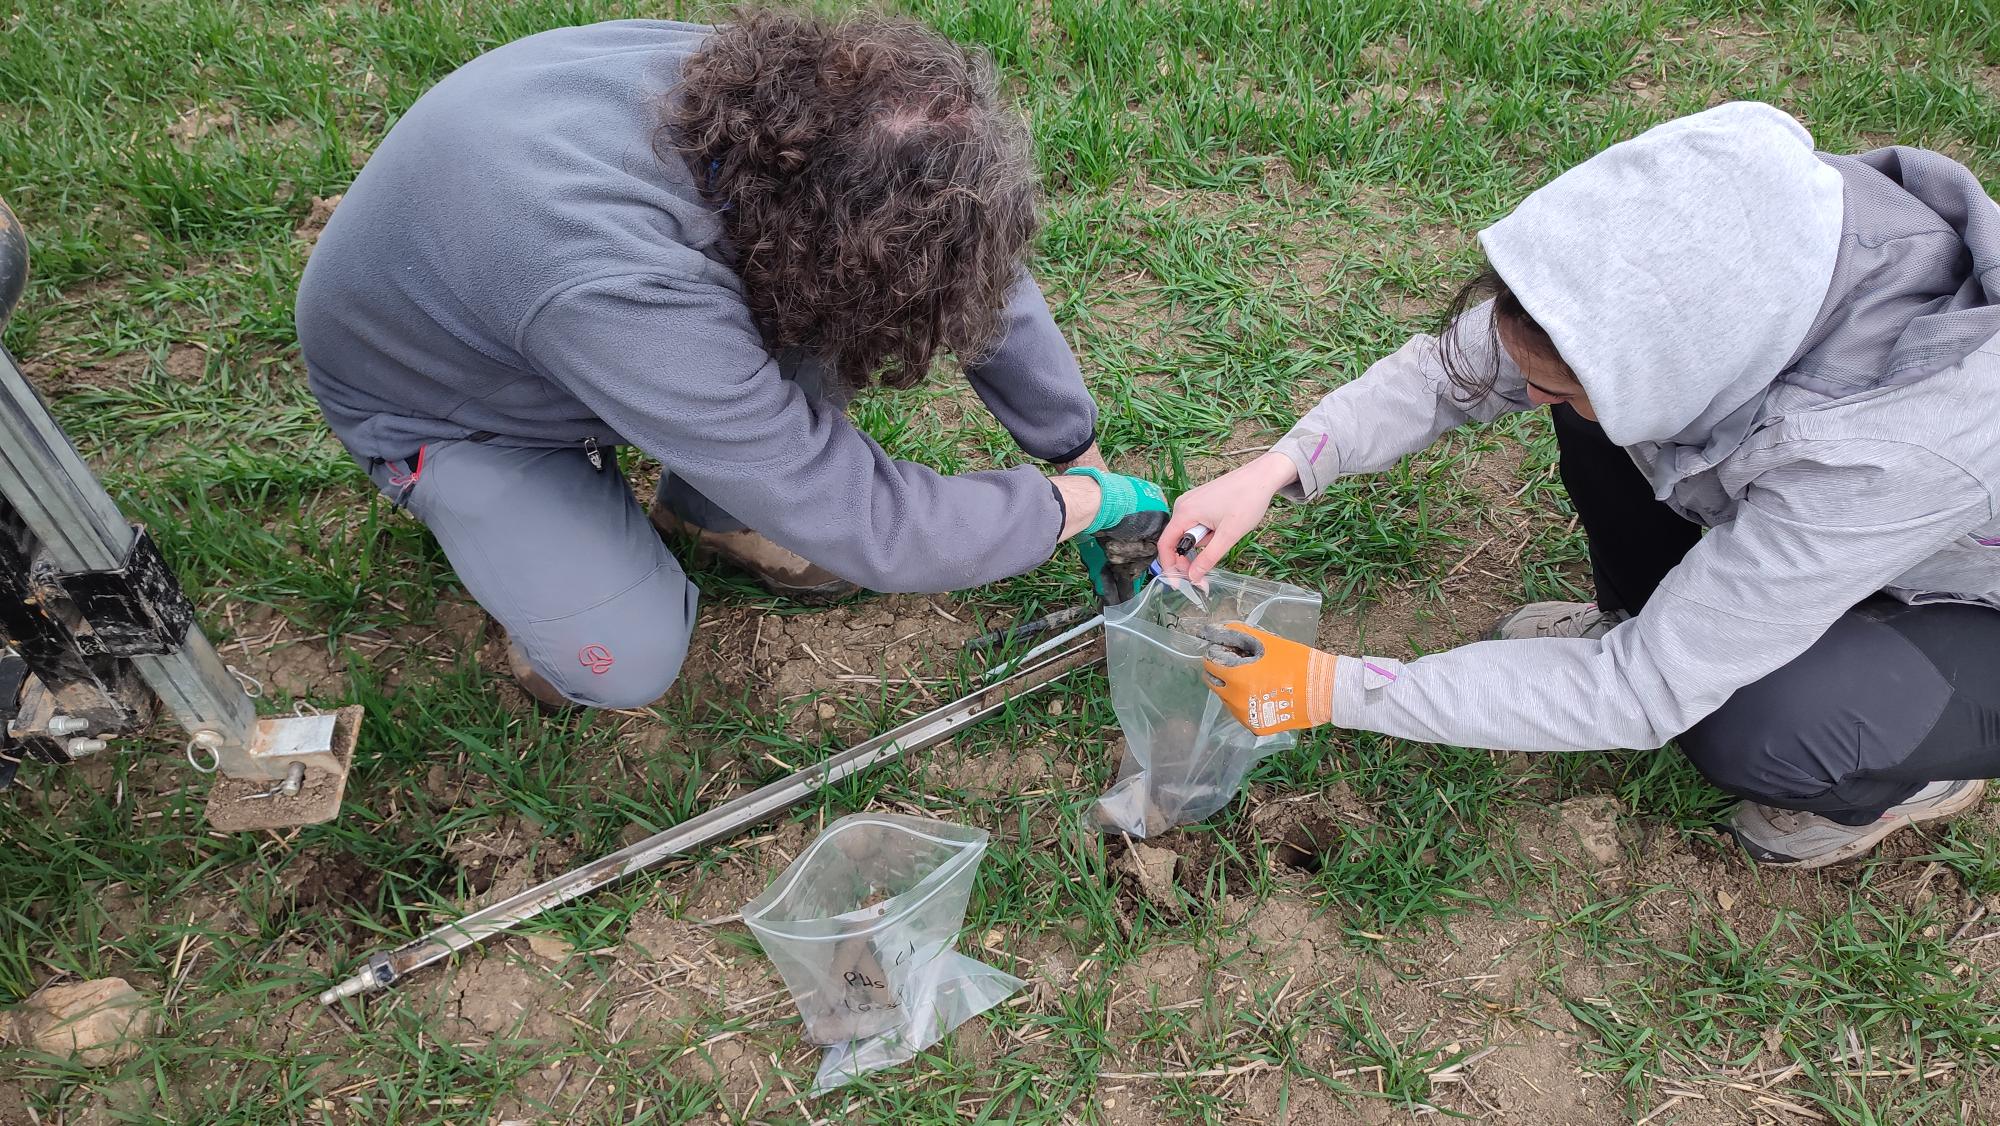
Armed with spades, augers, and curiosity, we selected four representative sampling points across the field. At each point, we “drew” a 2-meter circle and collected soil from the center and four directions (north, south, east, west), both at 0–20 cm and 20–40 cm depths. All vegetation residues were carefully removed before sampling, and samples from different depths were kept separate.
Each sample was meticulously labeled (for example, SBU020AD-1: Spain, Burgos, 0–20 cm, air dried, sample 1) and stored in glass containers, plastic bags, or wrapped in aluminum foil, depending on field conditions. The process was a blend of precision and teamwork, mixing, sieving, and dividing the soil until we had the perfect 1 kg sample, ready for analysis. Some samples were frozen at -80°C for future experiments.
From Field to Lab: What’s Next?
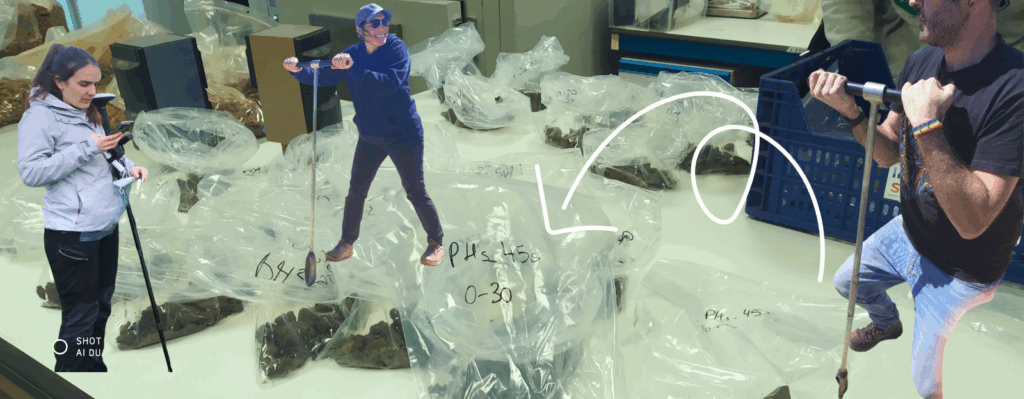
With our samples safely in hand, the next phase is laboratory analysis. We’re measuring electrical conductivity at specific points and running pot experiments to test how different plants respond to salty soils. The goal? To identify which species are best at thriving in, and helping to remediate, saline conditions—turning a challenge into an opportunity for sustainable agriculture and circular bio-based textiles.

Why It Matters: Science, Sustainability, and the Future
In our Belorado case study pHYBi explores how new technologies and classic fieldwork can work together to solve contamination problems and to contribute to a circular economy. By mapping, sampling, and modeling soil salinity, we’re laying the groundwork for smarter land management and more effective remediation strategies. And with every step, we’re helping to turn even the toughest soils into resources for a more sustainable, circular future.
Stay tuned as we continue our journey—combining innovation, collaboration, and a dash of adventure to make a real difference in Europe’s landscapes!
Want to learn more about our fieldwork, data, or the pHYBi project? Ckeck out our other sites: Case Studies | pHYBi
